High-Frequency Information and LLM Hallucination
How frequency-domain characteristics explain LLM hallucination on technical documents and our approach to preventing fabricated answers.
Fabricated answers are a top concern when using LLMs on technical data where precision is non-negotiable. In practice, model behavior spans a spectrum:
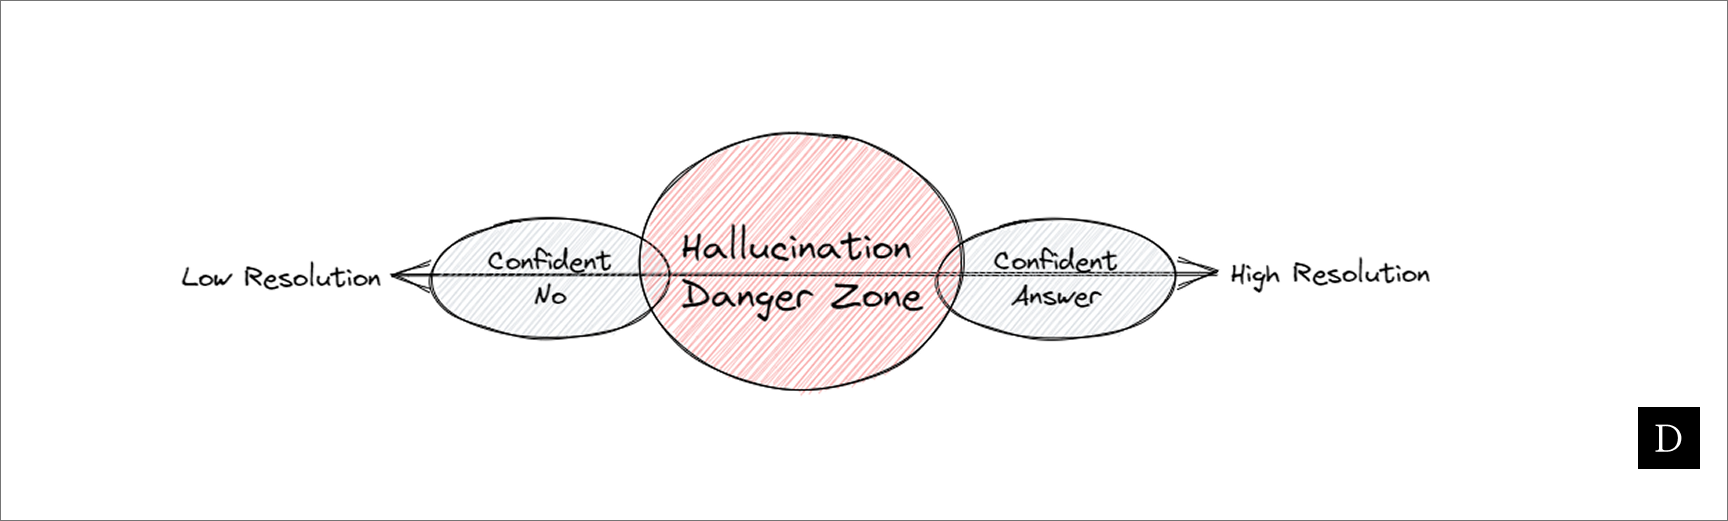
The hard part is predicting where a given input falls on this spectrum before trusting the output.
Similar to a musical chord composed of multiple notes, an image is made up of frequency components. Some parts carry low-frequency information (broad shapes, smooth gradients); others carry high-frequency information (edges, thin strokes, textures). When a model cannot reliably extract high-frequency details, it tends to fill gaps with plausible but incorrect content. This is a major problem for technical documents where the important information is concentrated at high frequency bands.
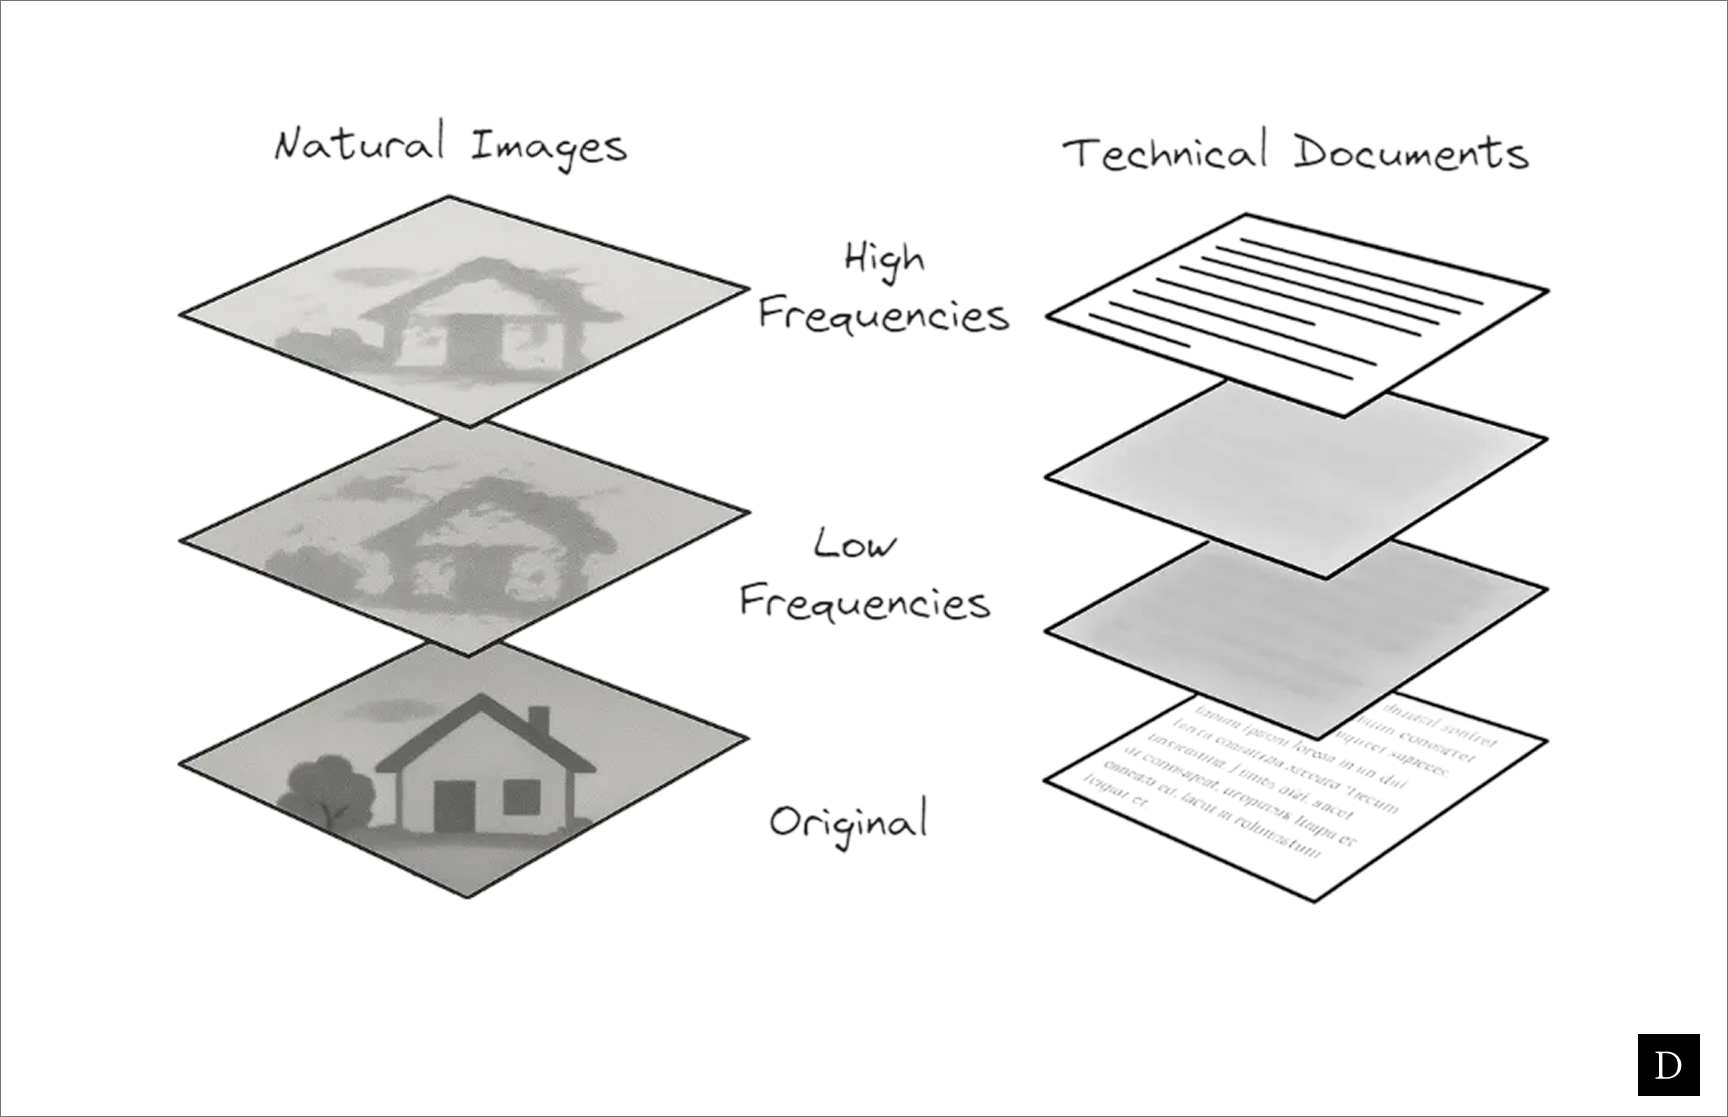
Notice how you get the "gist" of the image on the left at virtually any frequency band, whereas the lower frequencies of the technical doc decomposition convey very little information at all.
This concept has been explored and supported by numerous works, some of which have particularly relevant ways of expressing the issue:
Object hallucination will become more severe as visual uncertainty goes larger.
— Wang et al. (2023), Mitigating Object Hallucinations in Large Vision-Language Models
We connect these observations to the frequency-domain characteristics of different corruptions, revealing how transformers' inherent bias toward low-frequency processing explains their differential robustness patterns.
— Chen et al. (2024), Understanding Vision Transformers' Robustness
A key challenge lies in the distinct distribution of information within natural versus non-natural images. Non-natural images, often composed of geometric structures, concentrate essential information in high-frequency features (e.g., edges and lines), while low-frequency features (e.g., background) contribute less to semantic understanding.
— Lin et al. (2025), Non-Natural Image Understanding with Advancing Frequency-based Vision Encoders, CVPR 2025
Demonstration
The following example shows at what point an LLM's performance starts to noticeably degrade on a technical document.
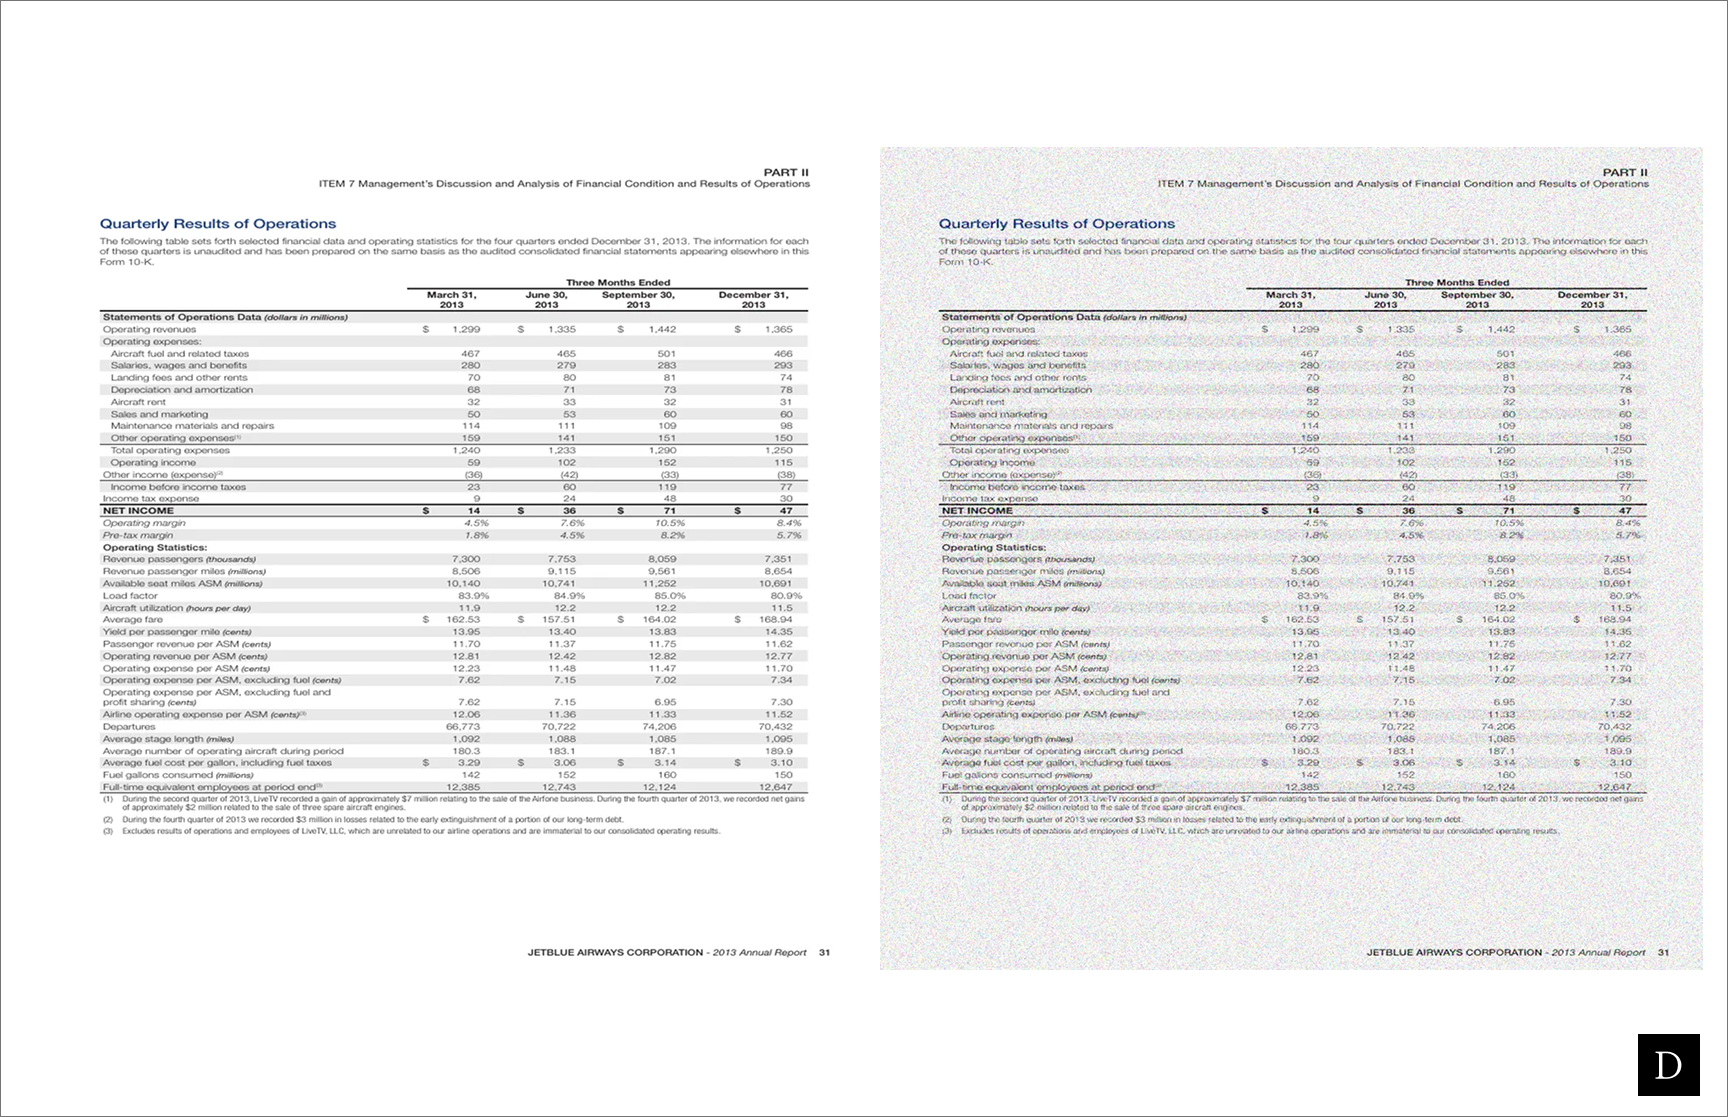 Image comes from DocLayNet, a public dataset under license CDLA-Permissive-1.0.
For both images, gpt-5 was asked What was the operating margin in June? On the left, we had near perfect accuracy and on the right, the model cited the correct figure fewer than 50% of the time.
Solution
- Frequency-aware preprocessing and encoding
Extract what matters before handing images to a general VLM. For documents or screenshots, run OCR first and pass recognized text as structured context.
- Confidence measures that flag weak signals
Deck prioritizes inputs that are most likely to yield precise answers and triages risky ones. Files that exhibit high-frequency loss are flagged for alternate handling.
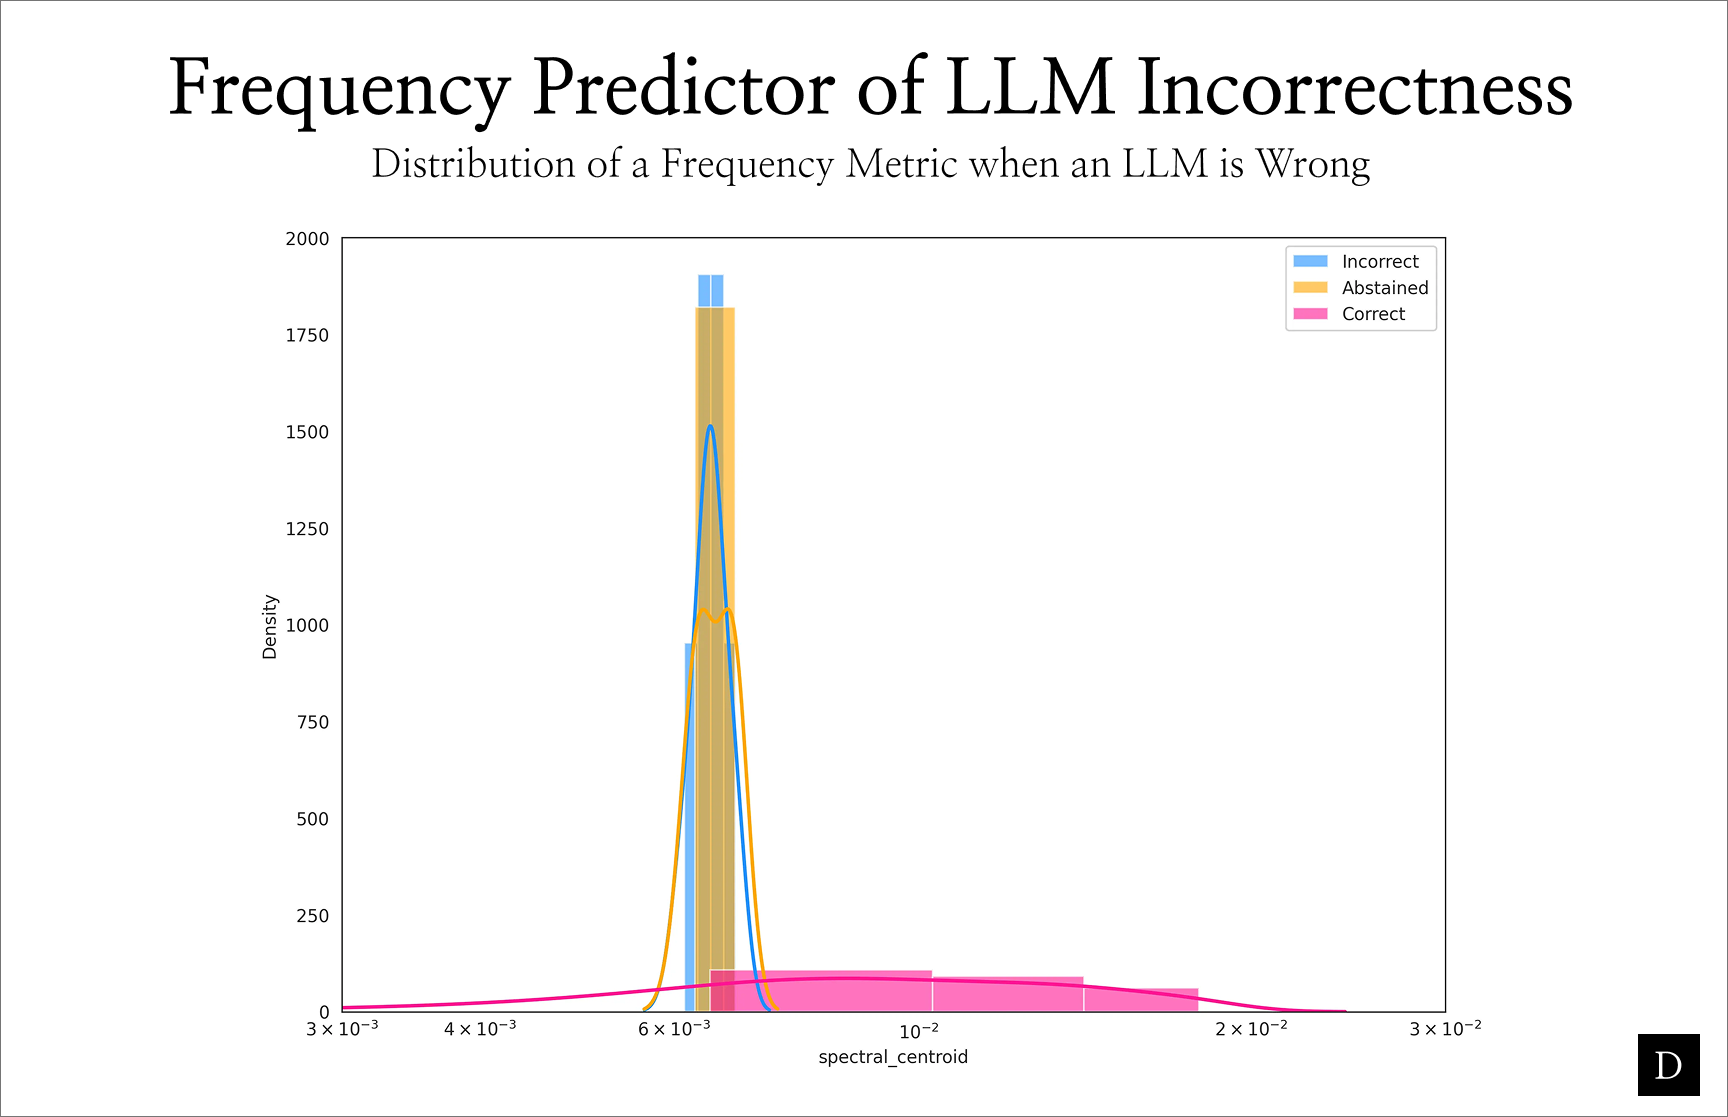
Here is just one example of a metric that Deck applies to input signals. When the spectral centroid of an image is particularly small, an LLM is very unlikely to yield the correct description and equally likely to (A) admit that a precise description is possible or (B) hallucinate a description.
- Multipass and ensemble techniques
Fabrications rarely repeat across independent extraction paths. We combine non-LLM extraction pipelines (with heuristics fine-tuned for financial data) with answers from an LLM. When multiple passes disagree, then that uncertainty can inform the user of low confidence.
Coming Soon
The impact of high-frequency artifacts are not limited to images. The same idea carries into spreadsheet analysis, where "thin strokes" are instead local interdependencies and formulas. Stay tuned for details on how Deck applies frequency-aware preprocessing, confidence scoring, and multipass agreement checks to tabular data.